DONE-FOR-YOU OUTBOUND ENGINE FOR ENTERPRISE & HIGH-VOLUME B2B SALES
SYSTEM 3

Your Pipeline, Built For You.
We identify B2B decision-makers who genuinely need what you sell — prospects with clear buyer intent, pain points, and market demand. We verify emails, craft AI-personalized outreach, and deliver campaigns straight to primary inboxes. You focus on closing.
We handle sourcing, targeting, and outreach — you focus on closing.
OVERVIEW
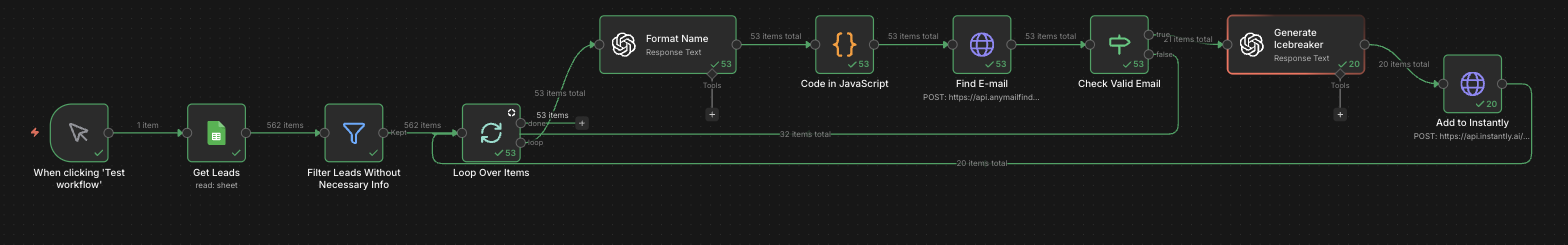
Automated Lead Processing Pipeline
Raw leads are imported, validated for completeness, normalized, enriched with verified emails (97% discovery, 95%+ validation), personalized with AI-generated icebreakers, and pushed to live campaigns — fully automated.
LEAD SOURCING
Enterprise Grade Lead Generation
Google Maps, public government databases, and LinkedIn Sales Navigator feed one enrichment layer, then become structured outbound-ready prospect lists.
PRIVATE INFRASTRUCTURE
Dedicated Private Sending Infrastructure
Your emails are sent through isolated, dedicated servers with their own IPs — your reputation and inbox placement are determined solely by your sending behavior, never impacted by other users.
Private Infrastructure Advantages
ADVANCED ROUTING
Automatic ESP Matching
Emails are automatically routed through matching providers — Gmail to Gmail, Outlook to Outlook — maximizing inbox placement and avoiding ESP overload.
CAMPAIGN ENGINE
Enterprise-Grade Email Campaigns at Scale
Our campaign infrastructure handles millions of emails monthly with intelligent sending, automated warmup, and real-time optimization — so every message lands in the primary inbox.
Fully Managed Campaign Operations
We handle the entire campaign lifecycle — from account setup and warmup to sequence optimization and reply management. You focus on closing deals.
BY THE NUMBERS
A Proven Model in a Booming Market
Outbound built for scale — low break-even, high margins, and strong market growth. Built for enterprise and high-volume B2B.
Simple Pricing
Book a call to get pricing tailored to your pipeline size and outbound goals.
Client Keeps
Incentives are perfectly aligned for high‑ticket B2B where cycles are long and quality matters.
Outsourced B2B Lead Gen
Services market size globally (2025–2026). Broader lead‑gen ecosystem exceeds $10B.
Projected CAGR
Growth through 2030+, driven by AI personalization, intent data, and enterprise outsourcing.
Competitive Edge
Most agencies optimize for meetings or retainers. We only get paid on closed revenue — a true risk‑free model at enterprise scale.
Low break‑even. High margins. A market expanding fast. That's the math behind System3.app.
CASE STUDY
Turning Cold Accounts Into Qualified Pipeline
A high-ticket B2B team needed a repeatable way to reach niche decision-makers without burning internal sales hours on list building, enrichment, and inbox management.
Unique users
Emails sent
Click rate
Audience built from buyer signals. System 3 sourced target accounts by industry, decision-maker role, and demand indicators.
Data enriched before outreach. Every lead was normalized, verified, personalized, and routed only after validation checks.
Campaigns launched through managed infrastructure. Warm inboxes, ESP matching, and sequence optimization kept outreach consistent.


RESULT
A repeatable outbound system with visible traction.
The screenshots above show traffic growth, landing-page engagement, and campaign execution compounding from early sends into measurable outreach activity.
CLIENT TESTIMONIAL
“We hired William to do cold email outreach for a brand new B2B software product launch. Traffic spiked immediately. I have no idea how he got such high click rates and gets through spam filters but what he does works. He also worked with us to restructure our website to get more demos booked and free trial signups. We would have had no idea the website itself was not structured correctly without his help. We plan to use his services for months to come.”Joe Sweeney — Founder of Blue Collar Voice
START THE CONVERSATION
Partner With System 3
Share a few details about your offer and outbound goals. If there’s a strong fit, we’ll map out how System 3 would be deployed for your pipeline within the next 30 days.
- Ideal for enterprise B2B, high-ticket sales & bulk orders
- No-obligation conversation to explore terms
- You keep 90% of every sale we help generate
Limited availability — System 3 installations are capped to maintain client performance.